DataGrip
NOTE: This is an sgr-specific article. To learn how to use Splitgraph with
DataGrip, see the
corresponding Splitgraph page.
JetBrains DataGrip can connect to the sgr engine and use it as a data source
to query checked out Splitgraph tables directly or through
layered querying.
Add PostgreSQL data source
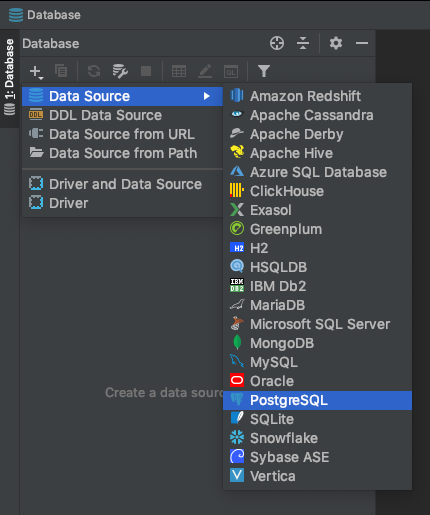
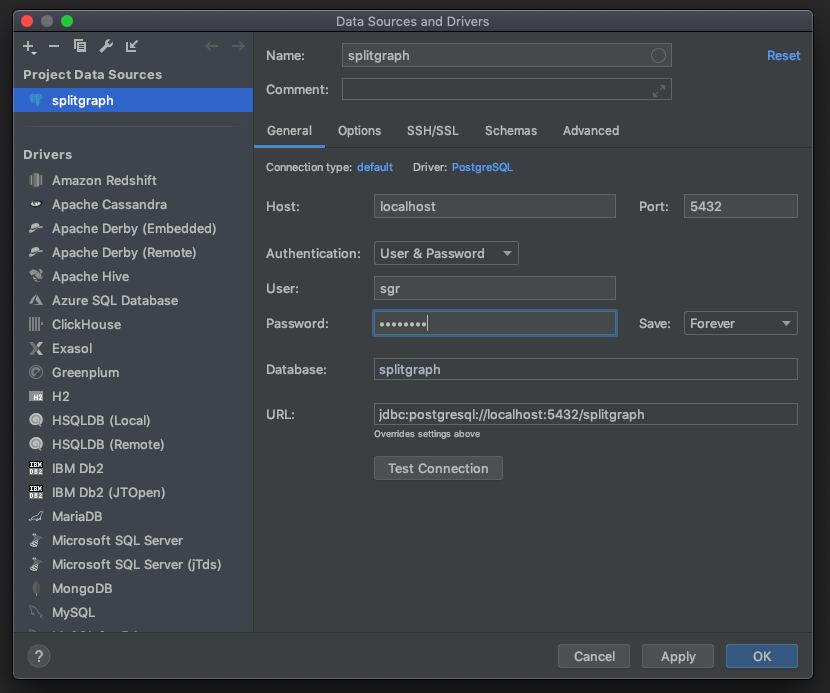
Configure PostgreSQL database
Use a JDBC connection string to add the sgr engine to DataGrip:
jdbc:postgresql://localhost:5432/splitgraph?user=sgr&password=[password]
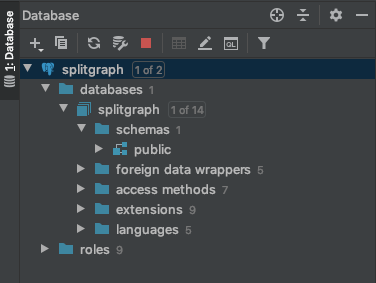
Missing schemas
By default, DataGrip only shows the "public" schema in the selector. sgr
checks data images out into schemas with the same name as the repository.
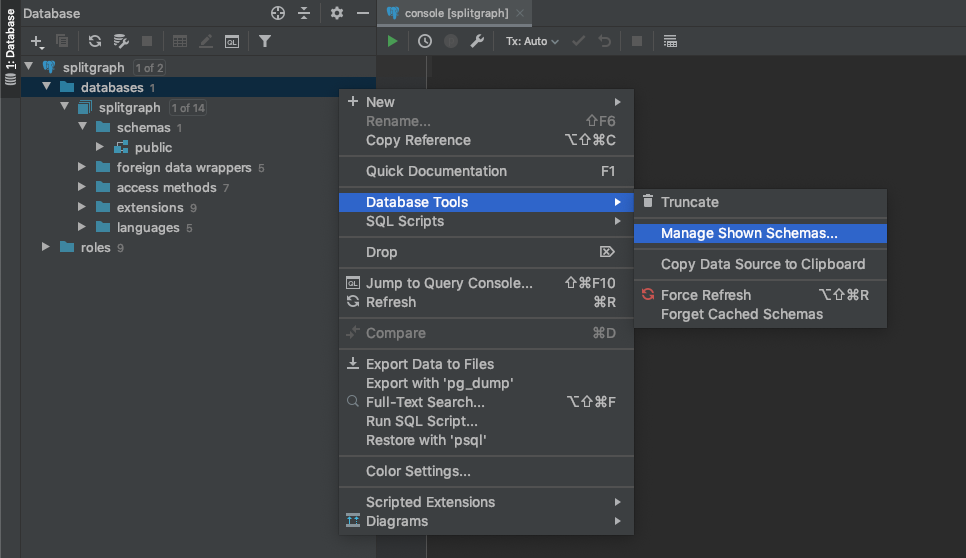
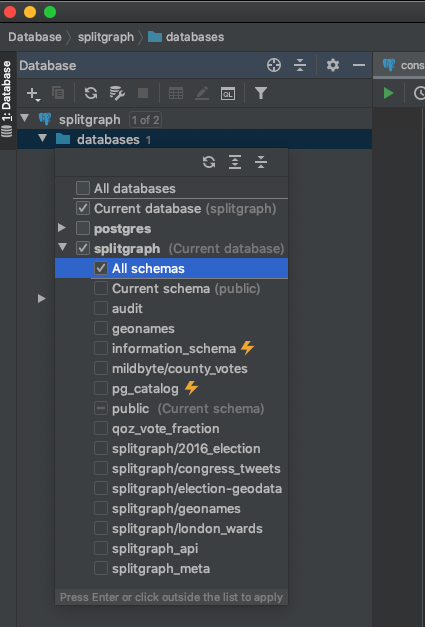
To solve this, right click on the database, then go to Tools, Manage Shown Schemas and check "All Schemas".
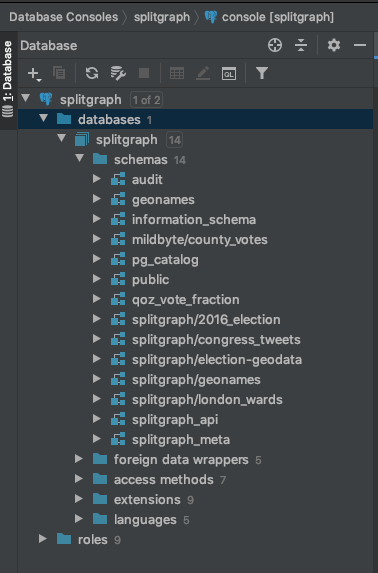
Your checked-out sgr datasets will appear in the schema selector.
Making geospatial queries
DataGrip has support for plotting geospatial data using PostGIS.
Make sure you have upgraded your engine to be PostGIS-enabled:
$ sgr engine upgrade --image splitgraph/engine:stable-postgis
$ sgr sql "CREATE EXTENSION IF NOT EXISTS postgis"
Clone a dataset and check it out:
$ sgr clone splitgraph/london_wards
$ sgr checkout --layered splitgraph/london_wards:latest
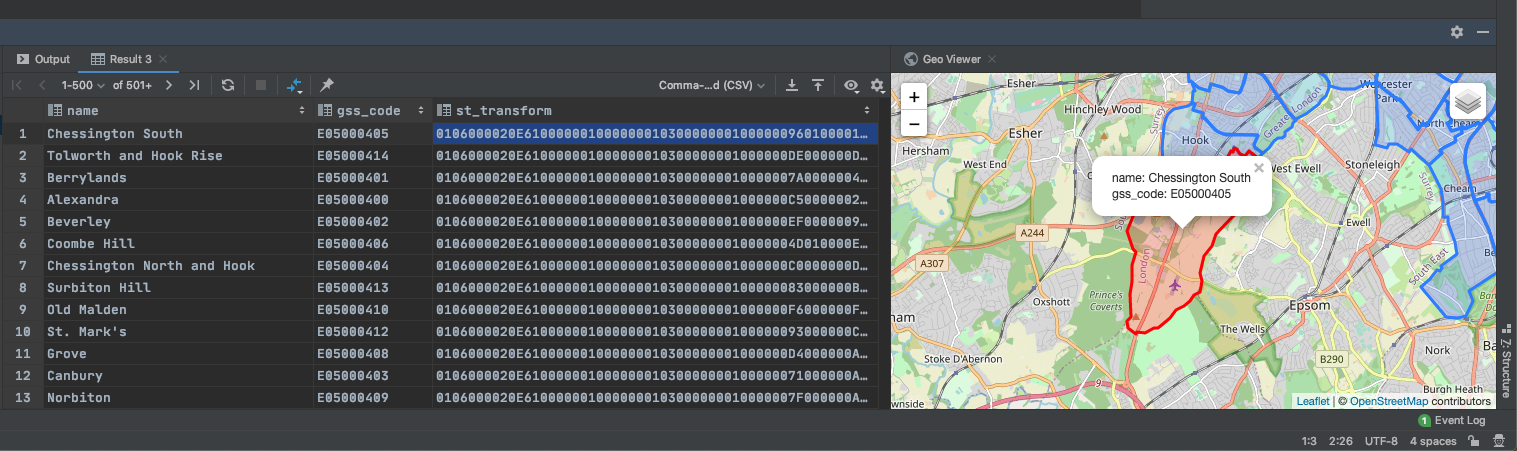
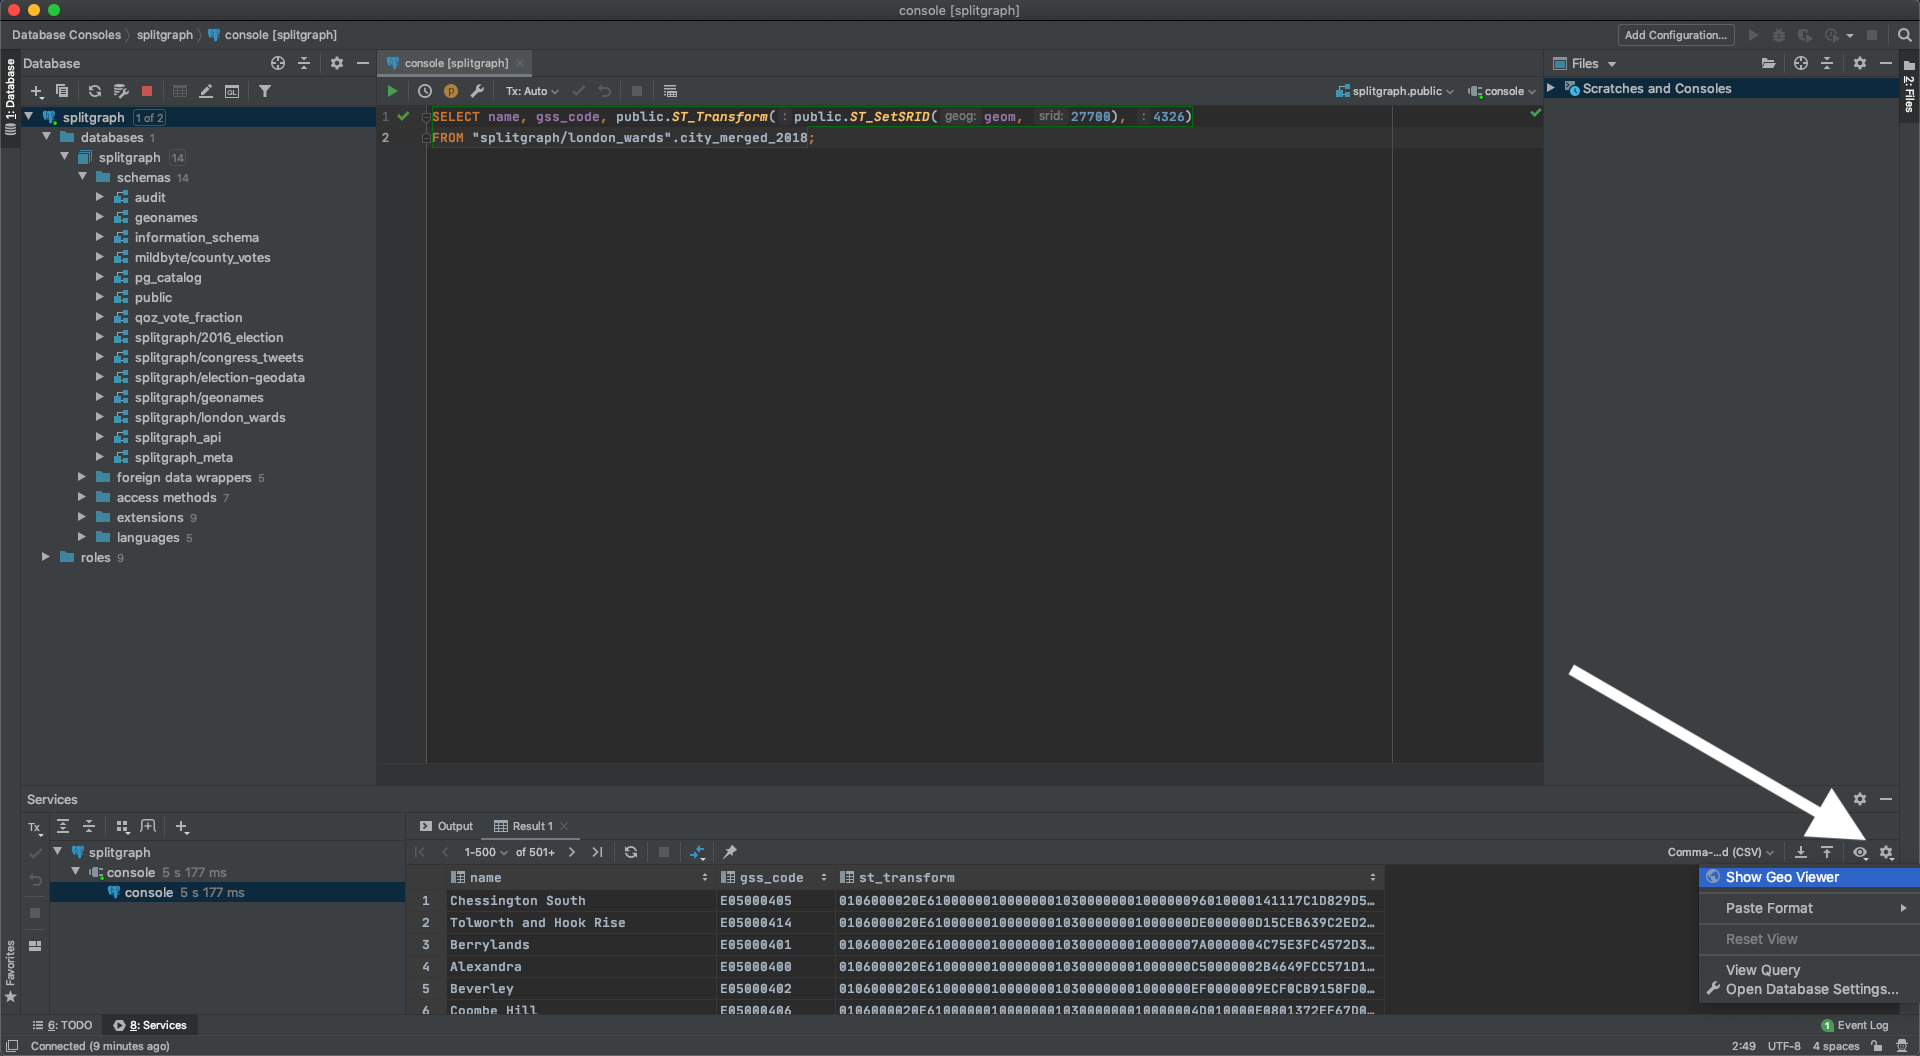
A good sample query is just plotting the geometry column in this dataset. This column is in the British National Grid projection and we need to convert it to the standard WGS 84 projection in order for DataGrip to plot it with an OpenStreetMap overlay:
SELECT name, gss_code, ST_Transform(ST_SetSRID(geom, 27700), 4326) FROM "splitgraph/london_wards".city_merged_2018
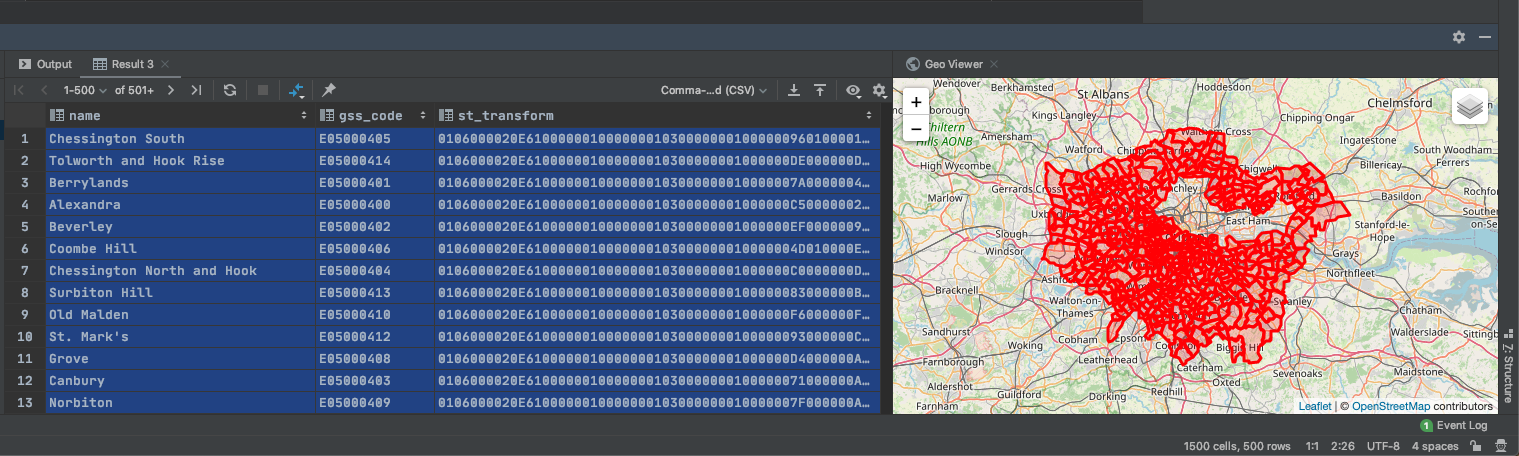
Toggle the geographical viewer by pressing the gear in the bottom right hand side of the window.
Use mouse/keyboard to select one or multiple rows containing polygons to plot (select all with Cmd+A / Ctrl+A).